Memory Leaks Detection Research Information
What are memory leaks?
“Memory leaks” or memory leaks are a common problem in many programs, including video games. They occur when a program does not properly free the memory it has allocated during its execution, which can lead to the program consuming more and more memory as it runs, until eventually all available memory on the system is used up and the program crashes or closes.
In video games, memory leaks can be especially problematic, as games often require large amounts of memory to function properly. If a game has a memory leak, it can lead to slow performance, stability issues, or even the game crashing.
To prevent memory leaks in video games and other programs, developers must ensure that they properly free up the memory they allocate during program execution, which involves identifying and correcting any memory management issues that may be present.
What do memory leaks produce?
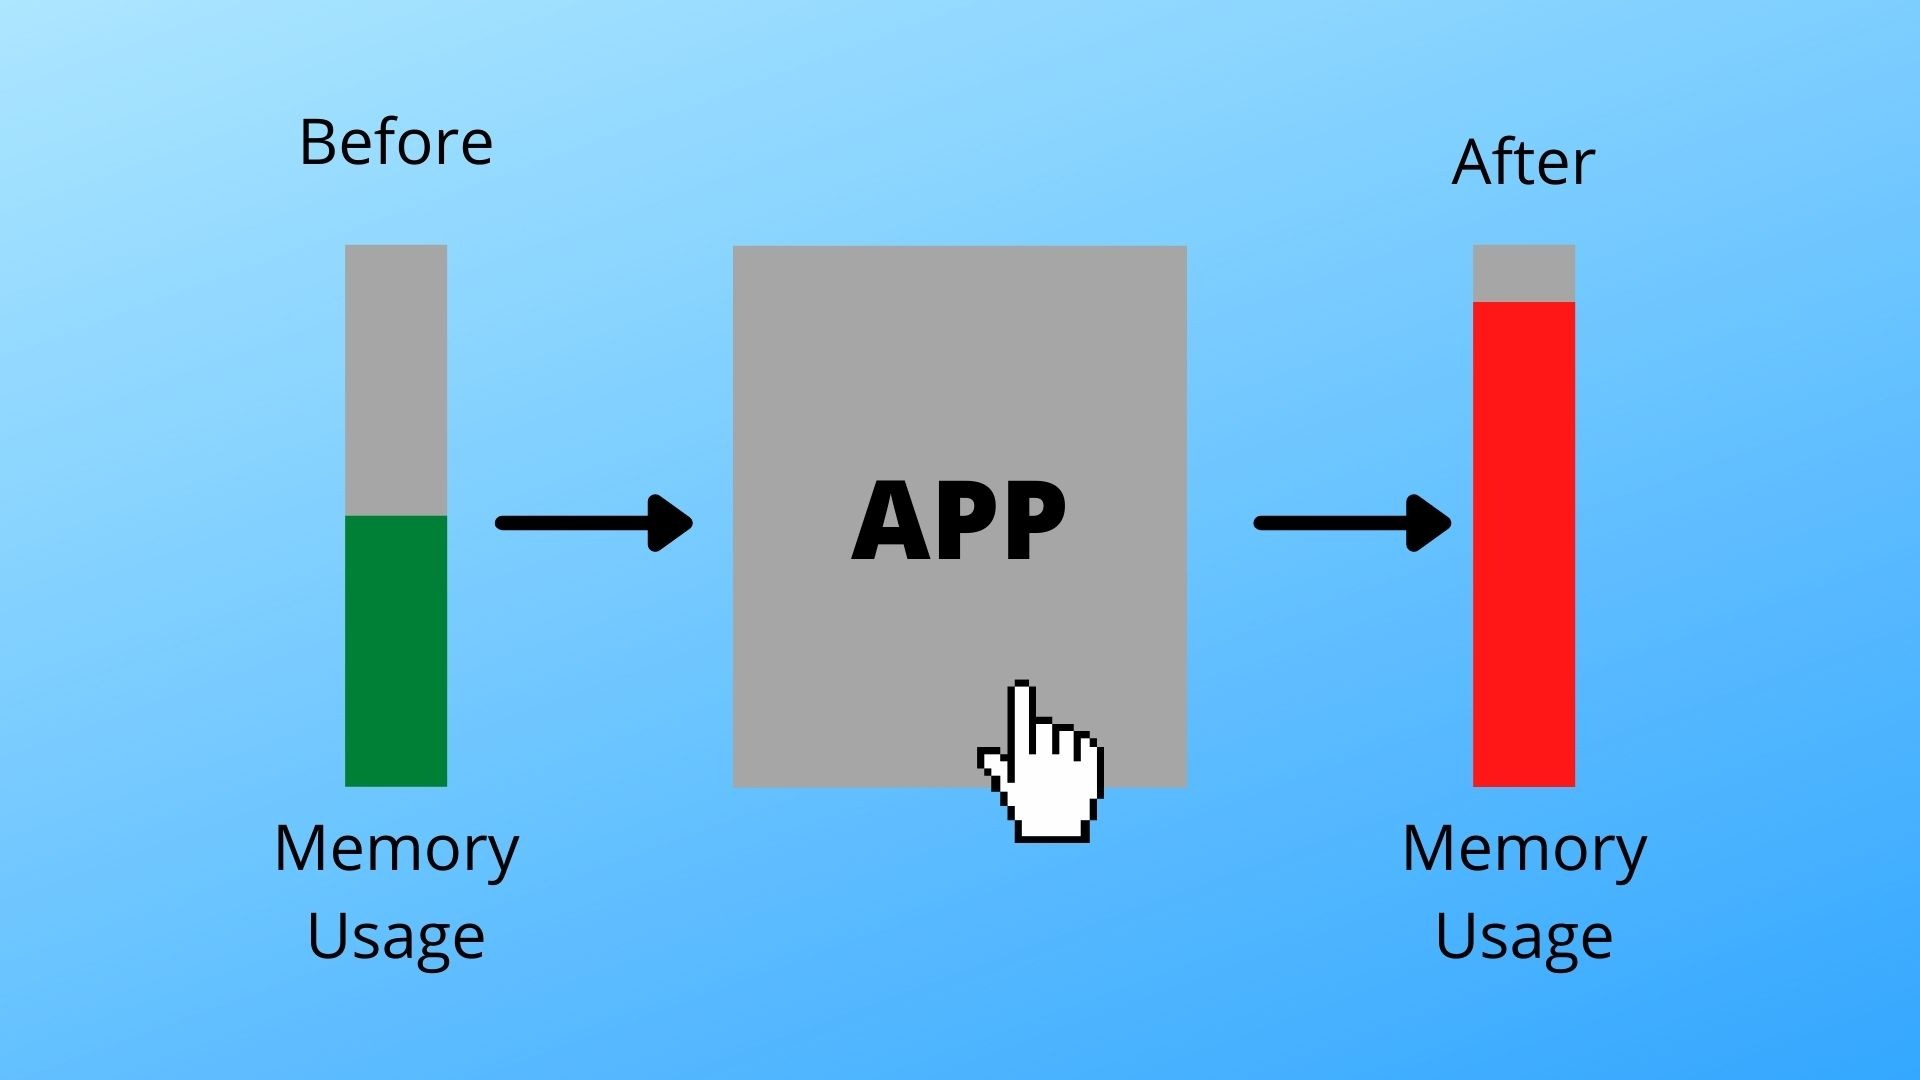
“Memory leaks” or memory leaks in video games can cause a number of problems, some of which include:
-
Decreased performance: As the program consumes more and more memory, it can become slower and less responsive, which can lead to a drop in frame rate, resulting in a less smooth gaming experience.
-
Stability issues: If a program consumes too much memory, it can exhaust system resources and cause the program to crash or exit unexpectedly.
-
Errors and unexpected behavior: Memory leaks can cause unexpected behavior in video games, such as graphical errors or collision problems.
-
Save Issues: If the game is unable to properly free up allocated memory, there may be issues saving player progress, which may lead to data loss.
-
Debugging difficulties: If there is a memory leak in the game, it can be difficult to detect and fix, especially if it occurs intermittently or under specific circumstances.
How to detect and solve them
-
Stress tests: Stress tests can help detect memory leaks in video games. Developers can run the game for an extended period of time and observe system memory consumption to detect any significant increase in memory usage.
-
Memory profiling: Memory profiling tools allow developers to see how memory is being used in the game. This can help pinpoint any problem areas that may be causing a memory leak.
-
Memory analysis tools: Use memory analysis tools: Memory analysis tools, such as Valgrind, can help detect “memory leaks” in program code. These tools can pinpoint parts of your code that aren’t freeing memory correctly and help developers fix the problem.
-
Manual tests: Developers can also perform manual tests in the game to detect any memory problems. This may include running specific tests on areas of the game that tend to consume a lot of memory.
-
Freeing memory correctly: It is important to ensure that memory is freed correctly in the program code. Developers can use appropriate memory free functions, such as “free” in C and C++, to free allocated memory.
Memory leak detection software
- Valgrind: It is a memory analysis tool that can detect and report problems such as “memory leaks”, uninitialized use of memory, memory access errors, among others.

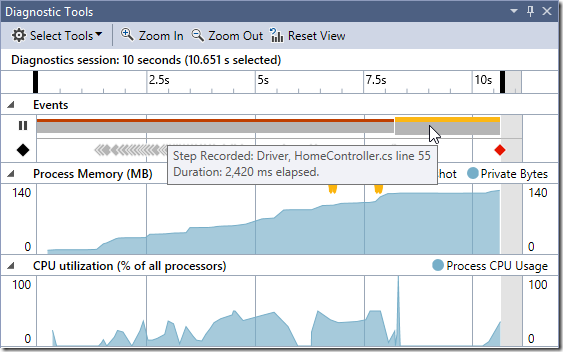
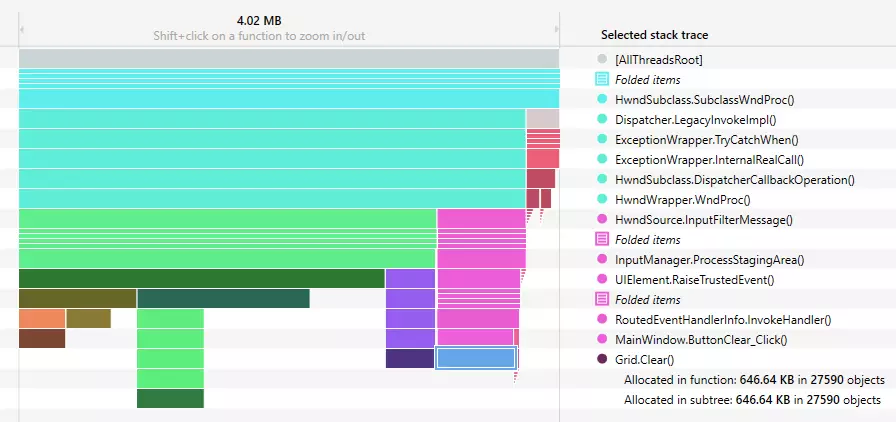
- Visual Studio Memory Profiler: It is a memory profiling tool for Windows applications that is integrated into the Microsoft Visual Studio development environment. Provides detailed information about memory usage and can help identify memory leak problems.
- JetBrains dotMemory: It is a memory profiling tool for .NET that provides information about the memory usage of an application. You can identify objects that are not being released properly and provide detailed information about their usage.
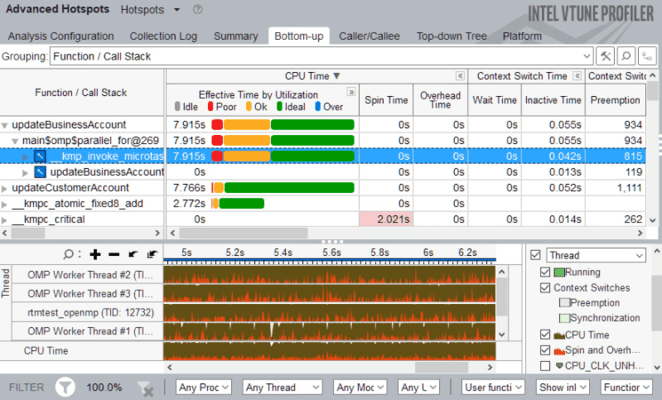
- Intel VTune Amplifier: It is a performance analysis tool that also includes a memory profiling functionality. It provides detailed information about memory usage and can help identify memory leaks and other performance issues.
Valgrind
Next, I will explain how to use Valgrind to detect and fix “memory leaks” in your code:
- Install Valgrind: To use Valgrind, you must first install it on your system. You can do it through the package manager of your operating system or by downloading it directly from the Valgrind website. I recommend having a Linux virtual machine to work with if using Valgrind, as it’s a good operating system that works perfectly for this kind of thing.
Linux command: sudo apt-get install valgrind
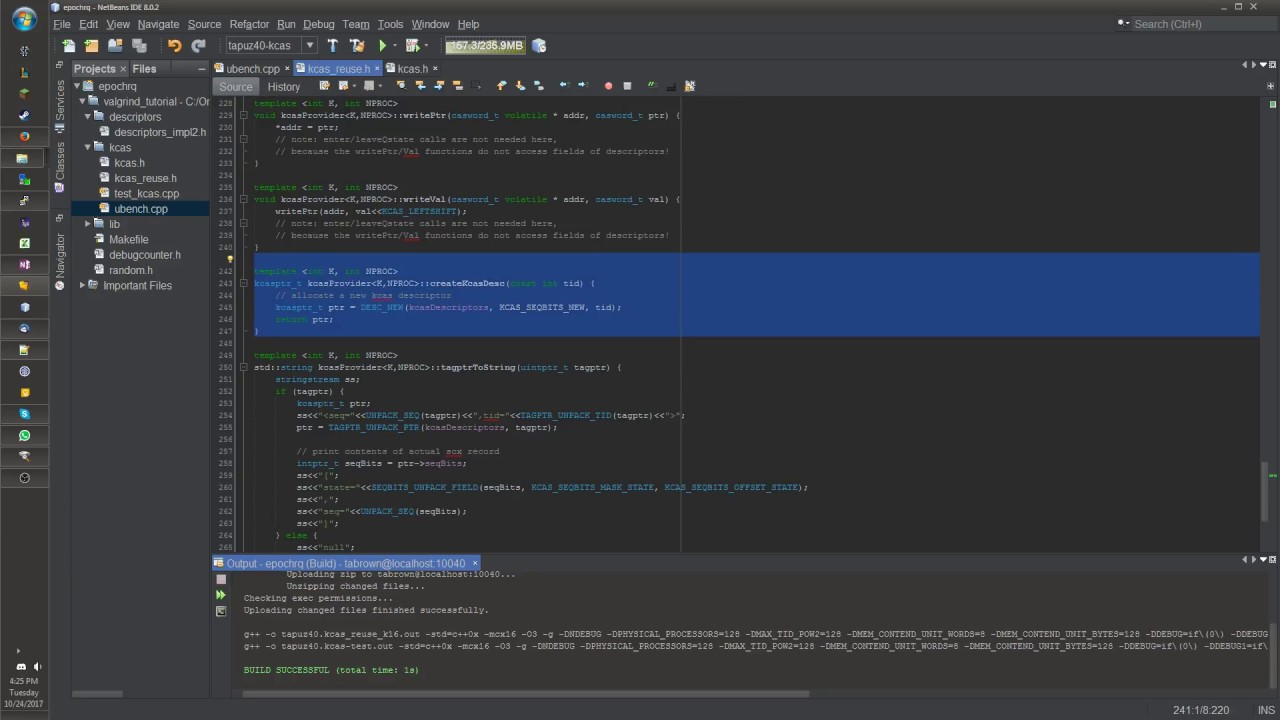
- Compile the code with debugging options: In order to use Valgrind, you need to compile the program code with debugging options enabled. This allows Valgrind to access additional information about memory usage in the program.

- Run Valgrind: Once the program is compiled with debugging options enabled, you can run Valgrind in your code using the “valgrind” command followed by the program name and any arguments the program needs. For example:

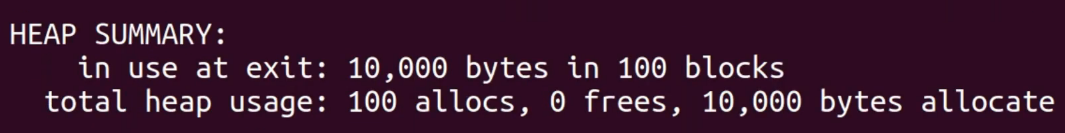
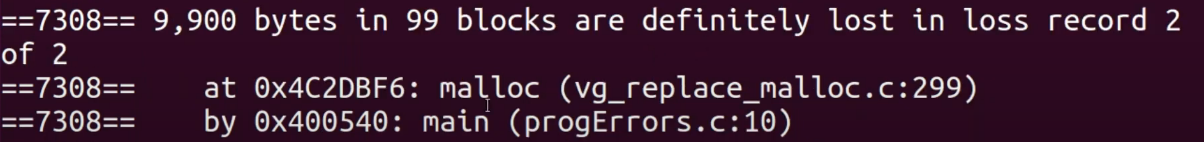
- Analyze Valgrind’s report: After Valgrind has run the program, it will produce a detailed report showing any memory leaks it has detected. You will need to carefully analyze the report to identify the problems and fix them.
Summary:
Error:
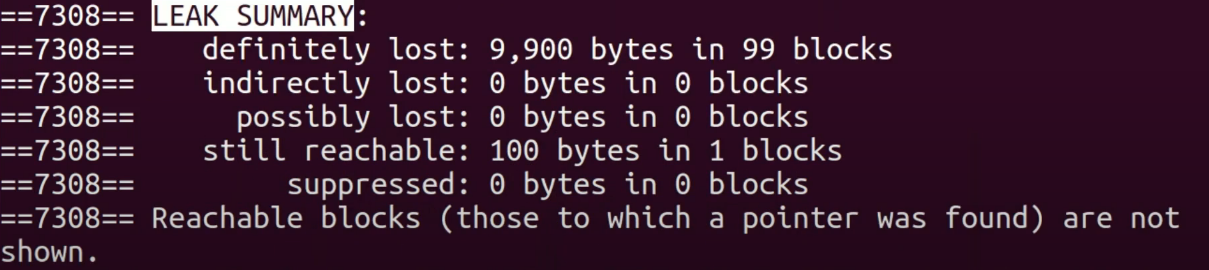
Leak Summary:
-
Fix memory leaks: Once you have identified the memory leaks in the Valgrind report, you need to fix them in the program code. It may involve modifying the way memory is allocated or released in the program.
-
Run Valgrind again: After making the fixes, recompile the program with debugging options enabled and run Valgrind again to make sure the memory leaks have been fixed.